查看器节点
The Viewer node allows viewing data from inside a geometry node group in the Spreadsheet Editor and the 3D Viewport.
Any geometry connected can be visualized in the viewport and its attribute values can be read in the spreadsheet.
Note
This node cannot be used in the Tool context—only in the Modifier context.
用法
激活与停用
Using Shift-Ctrl-LMB on any node or socket connects it to the viewer and makes it active. Using the same shortcut on empty space in the node editor makes deactivates the active viewer. When the active viewer is not visible anymore (e.g. another object is selected, or the current node group is exited), it is deactivated. The icon in the viewer node header can also be used to activate and deactivate it.
In the viewport, the Show Viewer option can turn off the viewer node visualization completely in order to see the final output of the object's evaluation instead.
属性可视化
When the viewer has a geometry and a separate value input connected, the values can be visualized with a viewport overlays. When possible, the attribute domain used to visualize the data is determined automatically. Otherwise, the viewer node falls back to the face corner domain on meshes and the point domain on curves. When necessary, the domain can be chosen manually.
The attribute overlay opacity can be controlled with the Viewer Node setting in the overlays popover.
The spreadsheet now only shows the "Viewer" column for the domain that is selected in the Viewer node.
钉住
It can be helpful to pin a specific viewer node in the spreadsheet. When pinned, the spreadsheet still references the viewer node even when it becomes inactive.
输入
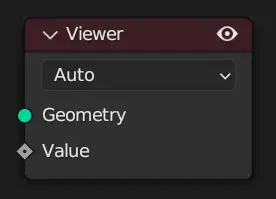
- 几何数据
电子表格
- 数值
要对几何体进行评估的字段。当按下链接输出的键盘快捷键时,这个值的类型会自动选择。然而,如果必须手动调整类型,它可以在节点编辑器的侧边栏中使用。
属性
- 数据类型
The data type used to evaluate the Value input, visible in the node side-bar.
- 域
The attribute domain used to evaluate the Value input. The Auto option chooses the domain automatically based on the connected nodes.
输出
此节点没有输出。