采样曲线

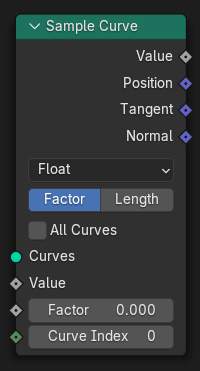
采样曲线 计算曲线上与曲线起始点相距一定距离的点,该点由长度或系数输入指定。它还输出从曲线上的该位置检索到的数据。采样值从采样点的每一侧处的评估的曲线点处的值线性插值取得。
Note
当曲线包含多个样条时,基于总累积长度(包括所有先前样条的长度)查找样品位置。样条的顺序与 电子表格编辑器 中显示的顺序相同。
输入
- 曲线
带有曲线组件的标准几何体输入。
- 数值
A field input to evaluate custom attributes. The evaluation is outputted through the Value output.
- 系数 系数模式
用于确定样品位置的总长度部分。
- 长度 长度模式
用于确定在采样之前沿着曲线行进多远的长度(以距离为单位)。
- 曲线编号
An index to only evaluate specific splines, these indices can be specified manually or from the 编号. This input is ignored when the All Curves property is enabled.
属性
输出
示例

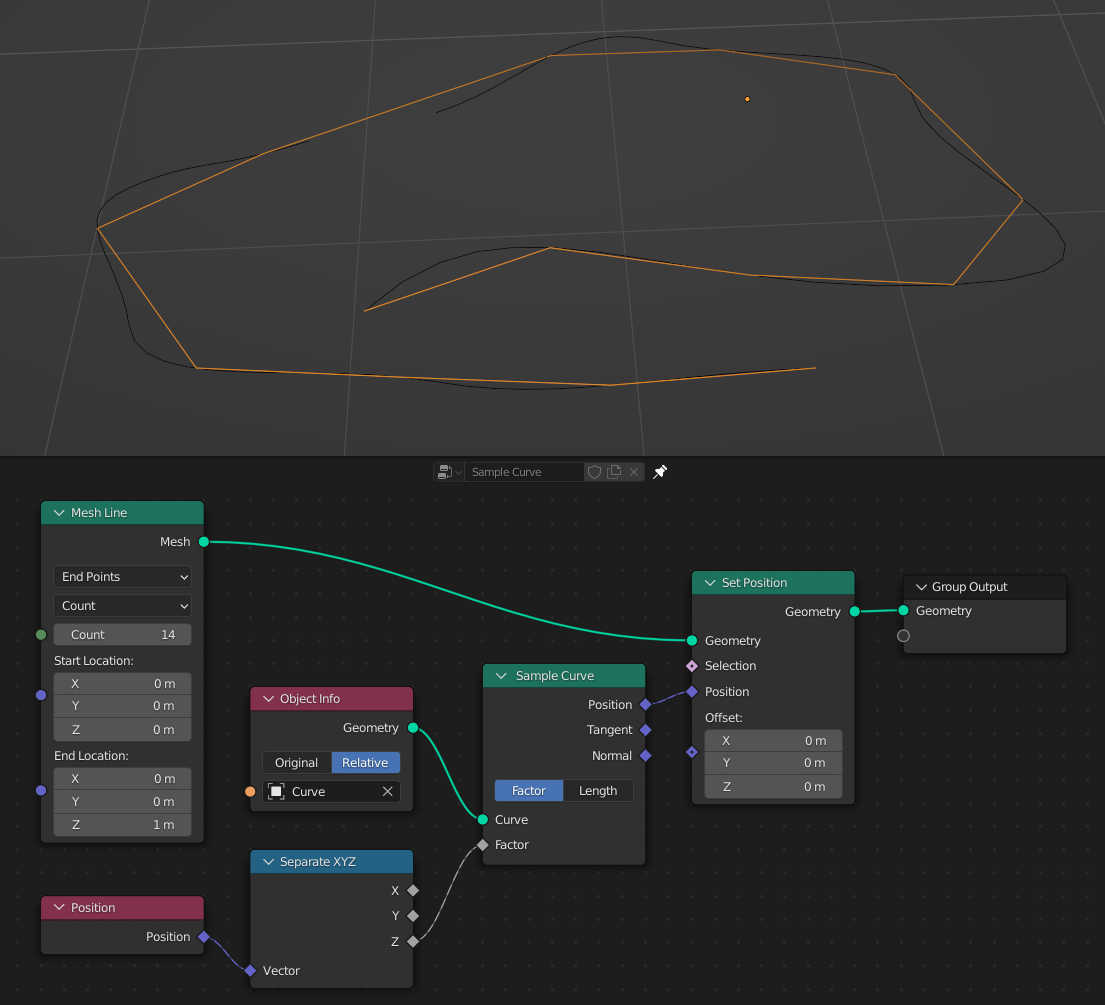
Here, the Count mode of the 重采样曲线 is recreated, except a mesh is used for the result instead of a curve. The Z axis of the position can be used as the sample factor because the position is between zero and one for the entire line.